 |
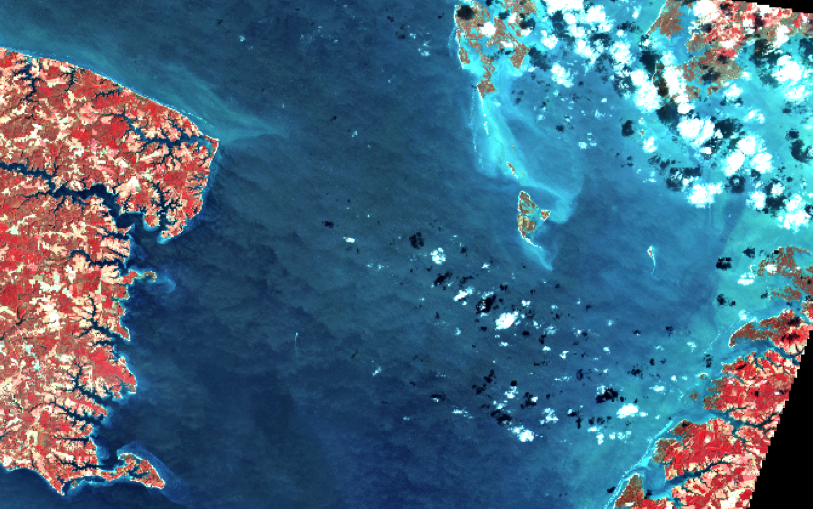
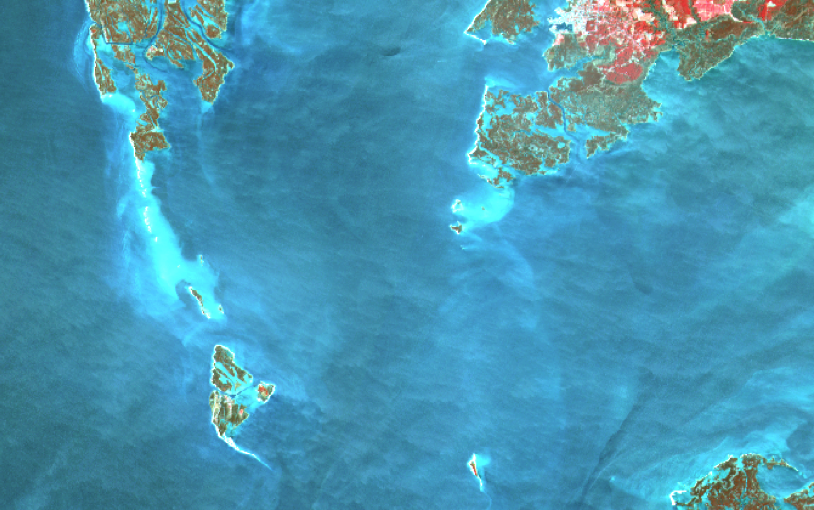
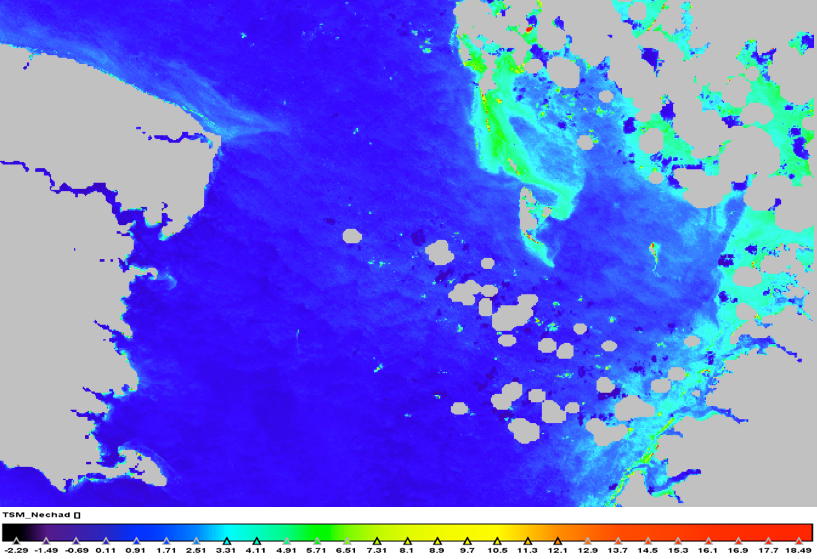
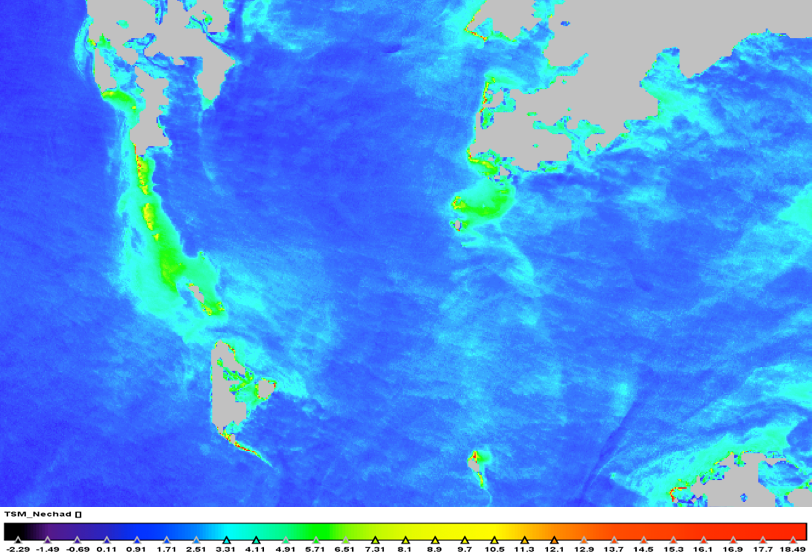
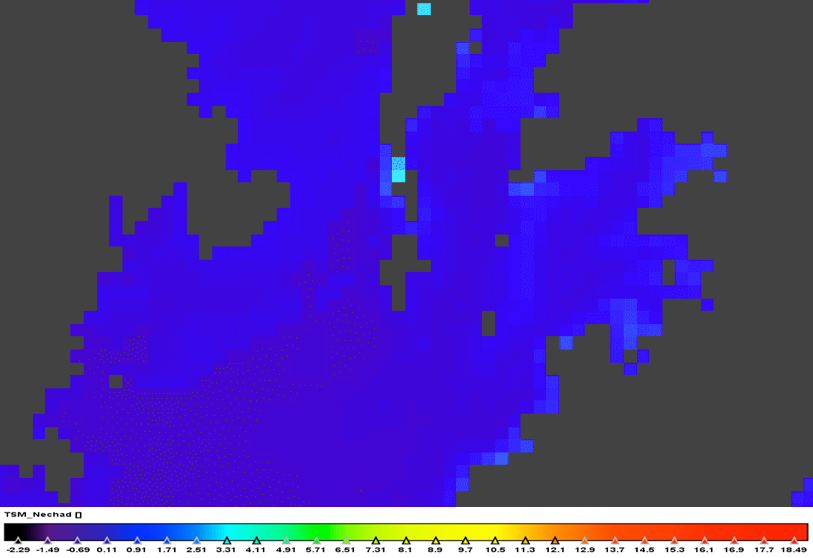
High Resolution Investigation using Landsat-5 and SPOT 4 Take 5The objective of the research was to demonstrate the potential of ocean colour imagery for coastal water bodies by using 6-month time series of high resolution optical data (SPOT-4 at 20m resolution and RapidEye at 5m resolution) collected during the SPOT-4 TAKE 5 campaign. A literature review was made in order to understand and apply the methods used to extract water quality parameters from high resolution sensors like the ones on board of the Landsat satellites (TM, ETM, ETM+) or SPOT (XS). Application examplesComparison of TSM derived from the Nechad approach on MODIS and SPOT for Chesapeake Bay: |
| 2013-02-06 | 2013-02-21 | 2013-04-02 | |
| SPOT RGB |  |
 |
 |
| SPOT TSM (20m) | 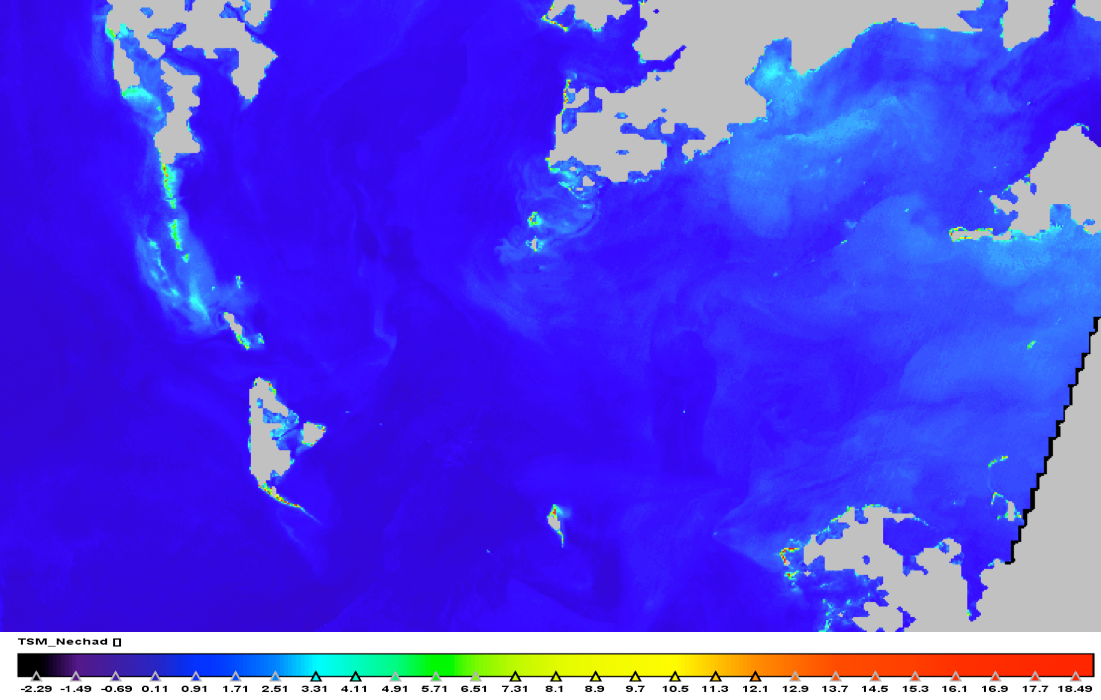 |
 |
 |
| MODIS TSM (1km) | 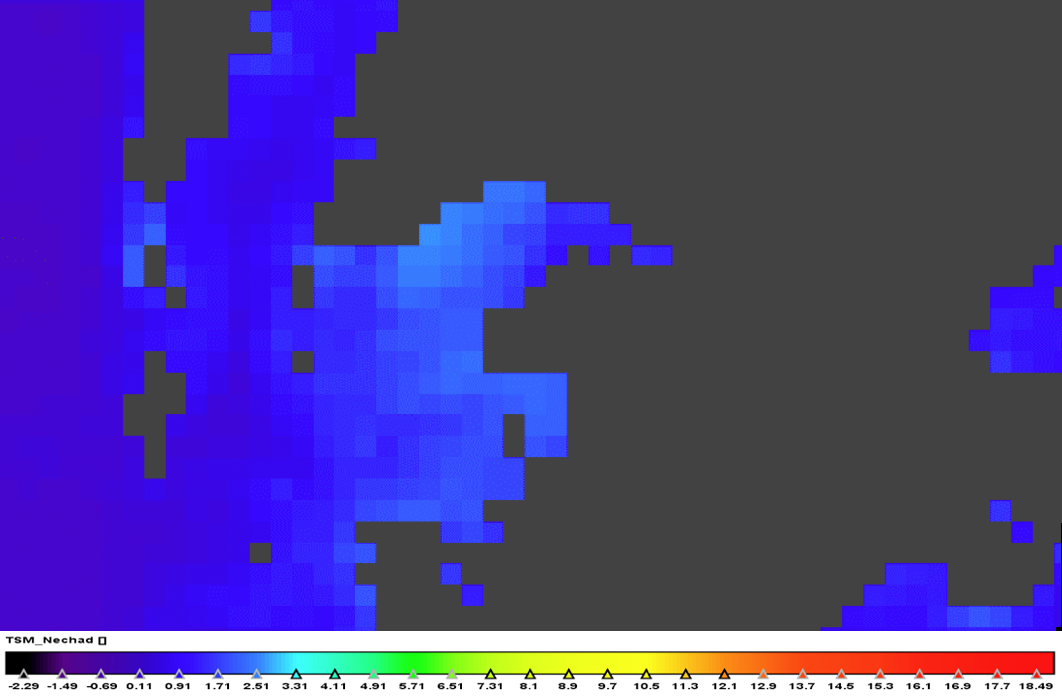 |
 |
 |
 |
|||
|
|
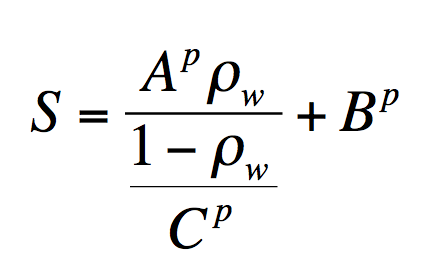
Several tests have been made: Comparison of Landsat-5 with MERIS products (Kd490, Turbidity and TSM)The algorithm study was done by performing an analysis on Landsat 5 TM data on the Chesapeake area. Landsat 5 is radiometrically closer to Sentinel 2 than SPOT 4. Kd490 testHere we used MODIS L2 OC imagery and compared them with SPOT 4 Take 5 directly using the best ratio, which was resulting from the previous analysis with Landsat 5- MERIS and adapting it to SPOT. MODIS TSM and SPOTHere the ratios were compared only around the Chesapeake Bay (TSM calculation made for Chesapeake exclusively by Ondrusek et al., 2012) The Nechad approachIn the paper published by Nechad et al. (2010), a single band algorithm for TSM retrieval based on a reflectance model is developed and calibrated, using seaborne reflectance and TSM measurements in the North Sea area. This algorithm has a simple application to multiple ocean colour sensors, taking into account that it is a semi-empirical approach on a determined area and with its particular spatial and temporal variability on specific IOPs.
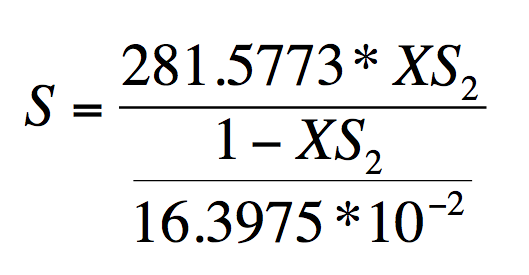
where After integration of the parameters, the values for this band are:
|